When does multi-token prediction make Gemma 4 faster?
At batch=1, MTP stayed faster than target-only decoding in all three runs for four of twelve vLLM GPU-and-prompt combinations. Agreement alone did not predict the result.
A draft can agree with a language model and still take longer than asking that model to generate the answer alone. Gemma 4's multi-token prediction, or MTP, adds a small assistant that proposes tokens for a larger target model to check. The assistant earns its cost only when accepted proposals save enough later target work.
This study follows that trade through the model, the serving system, and three kinds of prompts. It compares Gemma 4 E2B-it with its official assistant on A10, A100-80GB, H100, and B200 GPUs. Two comparisons matter throughout: MTP against target-only decoding inside an engine, and vLLM against the transformers reference implementation. An advantage in the second comparison is not evidence of an advantage in the first.
Updated . Benchmark runs: . Study source and implementation.
Agreement saves target passes, but drafting still costs time
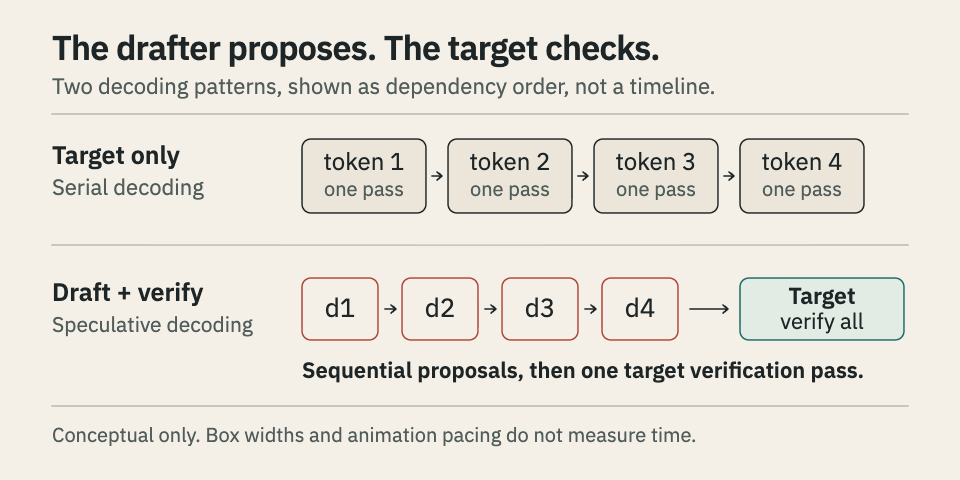
Target-only decoding runs the target model for each next token. Speculative decoding first runs a smaller drafter sequentially, then checks several proposals together with the target. The comparison below shows the dependency that changes: one target verification can replace several later target passes. The drafter's own sequential work remains, so the drawing does not establish a speedup.
Fewer target passes require an additional drafting stage
Four proposals also do not mean four finished tokens. In the next example, the assistant proposes d1, d2, d3, and d4. The target accepts d1 and d2, finds a mismatch at d3, and discards the remaining draft. It supplies correction c3, so generation continues from d1, d2, c3. The accepted prefix saves work only relative to what target-only decoding would have cost.
The target keeps an accepted prefix and corrects the first mismatch
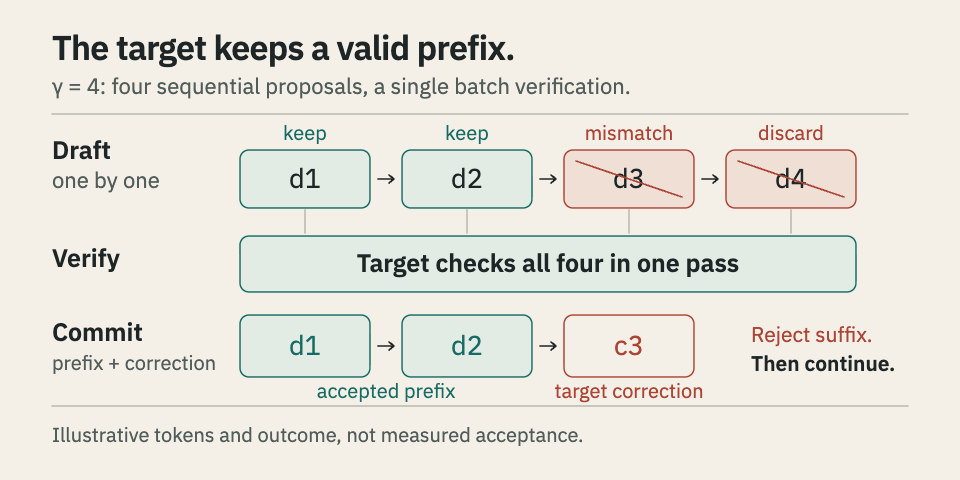
The number of proposals per round is gamma. This comparison fixes gamma at 4 so the runs have the same draft length. A heuristic schedule changes that length as generation proceeds, so it can change both drafting cost and the amount of work the target can avoid. 1
Acceptance measures agreement between proposals and the target, not the time spent obtaining that agreement. A useful explanation of speed needs both sides of the system. The model sets compute and memory requirements, while the engine schedules drafting and verification.
Evidence: Leviathan et al. on speculative decoding. Google's Gemma MTP documentation. Why the study fixes gamma at 4.
The model's memory footprint changes the hardware question
The assistant is small compared with the target, but both models occupy memory. The model inventory below records parameter counts and BF16 artifact sizes from the study's Hugging Face API snapshot. Those stored bytes help explain deployment requirements. They are not a count of the arithmetic performed for every generated token, and they have not been freshly verified for this rewrite.
| Model | ||
|---|---|---|
| google/gemma-4-E2B-it | 5,123,178,051 | 10,246,621,918 B (9.5429 GiB) |
| google/gemma-4-E2B-it-assistant (drafter) | 77,993,476 | 157,565,344 B (0.1467 GiB) |
The gap between stored parameters and per-token arithmetic comes partly from Per-Layer Embeddings, or PLE. E2B is a dense transformer with embedding lookups, not a mixture-of-experts model. A lookup reads the row selected by a token ID rather than multiplying every stored embedding weight. The comparison below distinguishes that memory capacity from the routed feed-forward computation of MoE. The study uses 1.91 billion active parameters for utilization estimates, while the model card cites 2.3 billion effective parameters. That accounting difference remains unresolved.
| MoE (e.g. Gemma 4 26B-A4B) | PLE (Gemma 4 E2B / E4B) | |
|---|---|---|
| What's stored | N expert FFN weight matrices | Per-token embedding vectors per layer |
| Op type | Matmul (gated FFN) | Gather (lookup by token id) |
| FLOPs/token | Nonzero (top-k experts × FFN) | Zero (memory read only) |
| Routed by | Learned router over hidden state | Token id (deterministic index) |
| Why "active" < total | Top-k of N experts selected | Only one row per layer touched |
| Adds | Compute capacity (sparsely activated) | Memory capacity (deterministically indexed) |
Those memory reads make hardware bandwidth relevant beside peak arithmetic throughput. The four measured GPUs span Ampere, Hopper, and Blackwell, with different memory systems and capacities. Their specifications below are the study's recorded hardware snapshot, not new measurements. The B200 peak-compute entry depends on a provisional architecture constant, so its displayed precision does not make that estimate definitive.
| GPU | Arch | ||||||
|---|---|---|---|---|---|---|---|
| A10 | Ampere | 86 | 72 | 384 | 62.48 | 600.10 | 24 |
| A100-80GB PCIe | Ampere | 80 | 108 | 5120 | 155.93 | 1935.36 | 80 |
| H100 80GB HBM3 | Hopper | 90 | 132 | 5120 | 535.27 | 3352.32 | 80 |
| B200 | Blackwell | 100 | 148 | 7680 | 2382.40 | 7672.32 | 180 |
Memory capacity is only one deployment constraint. A CUDA wheel must also contain code that the GPU can execute. The study's vLLM 0.21.0 wheel discussion identifies sm_75 as the oldest included target, followed by sm_80, sm_86, sm_89, sm_90, sm_100, and sm_120. The SM version identifies a GPU's compute capability, not its number of streaming multiprocessors. A driver compatibility package cannot supply missing kernels for an older architecture. 2
Precision introduces a separate constraint. BF16 and FP16 are two-byte floating-point formats with different precision and exponent ranges. The model sizes above describe BF16 artifacts, while the hardware table labels its compute denominator as peak FP16 throughput. Neither label means that every GPU has the same native arithmetic support. Native BF16 tensor-core support starts with Ampere. Binary compatibility alone does not establish a BF16 execution path for the guide's Turing candidates. 3
The deployment tiers below are broader than the four-GPU experiment. The source states a 16 GiB BF16 memory floor with max_model_len=4096, but also lists an 11 GiB RTX 2080 Ti. Those statements do not establish a consistent minimum, and the unmeasured candidates are not additional benchmark evidence. The study's CUDA-wheel guidance also specifies an R535+ driver baseline, with cuda-compat-12-9 or cuda-compat-13-0 where needed. Such packages address driver compatibility, not missing SASS or memory capacity.
| Tier | Example GPU | sm_ | vLLM 0.21.0 Gemma 4 MTP | |
|---|---|---|---|---|
| Minimum | T4 / RTX 2080 Ti | sm_75 | 16 / 11 GiB | Works at BF16 with max_model_len <= 4096; T4 is the cheapest cloud option |
| Recommended | A10 / L4 | sm_86 / sm_89 | 24 GiB | Headroom for longer context and MTP draft cache |
| Recommended | RTX 4090 | sm_89 | 24 GiB | Best single-card consumer option |
| Production | A100 40/80GB | sm_80 | 40 / 80 GiB | Full MTP + batching + PagedAttention |
| Production | H100 / H200 | sm_90 | 80 / 141 GiB | Highest acceptance throughput; MTP scales with batch |
The experiment also depends on access to the model weights and an authenticated service, not just a suitable card. In the companion model-serving project, local preparation creates an environment with HF_TOKEN for model access and MODEL_API_KEY for the service. Installing the benchmark dependencies at this stage keeps the load generator available to the same deployment workflow. The preserved example shows those dependencies rather than a new benchmark configuration.
cd multi-token-prediction
cp .env.example .env
# fill HF_TOKEN, MODEL_API_KEY (any opaque string)
uv sync --extra bench
Modal then supplies persistent storage and deployment credentials around those model artifacts. The bootstrap script below configures CLI authentication, registers the model-api-key and hf-token secrets, and creates the gemma-models volume. Its idempotent setup makes the same weights available across redeployments, which matters when comparing MTP and baseline containers rather than comparing different download states.
# Idempotent: token, secrets, and persistent volume for weights.
bash deploy/modal/setup_modal.sh
Evidence: Recorded model counts and byte sizes. Study hardware specifications. Deployment requirements and their qualifications. What the utilization estimates assume.
The serving engine changes what a saved pass is worth
Once the models fit, the engine determines how much time each draft and verification costs. The transformers reference service calls generate(assistant_model=...), while the vLLM deployment uses its own serving stack. The component map below separates model execution from the API, load generation, telemetry, and deployment scripts. That separation is necessary to attribute a difference to speculative decoding rather than to a different request path.
| Path | Role |
|---|---|
| server/mtp_engine.py | Loads target + drafter, calls generate(assistant_model=...) per the Gemma 4 reference. Exposes generate() and stream_generate(). Tracks accept/propose counters. |
| server/api.py | OpenAI-compatible FastAPI service: /v1/chat/completions (stream + non-stream), /v1/models, /healthz, /metrics. X-API-Key and Bearer auth. |
| bench/load_runner.py | Concurrent SSE benchmark; persists JSON + Prometheus per run. Captures acceptance rate. |
| bench/gpu_probe.py | Live VRAM and peak FP16 TFLOPS via NVML. |
| bench/mfu.py | Exact MFU = 2 * N_active * tokens/sec / peak_TFLOPS. |
| deploy/modal/modal_app.py | Modal app: GPU container, ASGI mount, persistent volume for weights. Transformers MTP engine. |
| deploy/modal/vllm_modal_app.py | Modal app: vLLM v0.21.0 serving stack with num_speculative_tokens env propagation. |
| deploy/modal/run_ab.sh | One-shot A/B sweep: deploys MTP, warms, benches, redeploys baseline, benches, restores MTP. |
| deploy/modal/run_const.sh | Same flow with MTP_SCHEDULE=constant, N=4 for apples-to-apples vLLM parity. |
| deploy/modal/vllm_run_ab.sh | vLLM A/B: num_speculative_tokens=4 vs no-spec-config baseline. |
The architecture uses two same-type GPU containers, but only the server GPU runs inference. The bench GPU runs load_runner and NVML-probes its own board. It does not execute the model and does not directly measure the inference server's utilization. The diagram makes that boundary visible: deployment scripts start the service and the benchmark separately, and results pass through the bench-results volume into metrics/runs/. Matching GPU types supplies hardware denominators, not server-side utilization telemetry.
The engines also manage attention and cached tokens differently. The KV cache stores attention keys and values from earlier tokens, so later decoding steps can reuse them. PagedAttention organizes that storage, while FlashAttention reduces memory traffic during attention computation. Verification has its own execution costs. These mechanisms can explain an engine advantage, but this experiment does not isolate their individual contributions. In particular, concurrency=1 results do not measure a gain from serving many requests through continuous batching. 4
Version choice defines which speculative paths are available. The study pins vllm/vllm-openai:v0.21.0. Its recorded release history places base Gemma 4 support in PR #38826, merged on 2026-04-02 and released in v0.20.0 on 2026-04-27. Gemma 4 MTP support followed in PR #41745, merged on 2026-05-06 and released in v0.21.0 on 2026-05-15. This is the study's version boundary, not a claim about the latest release today.
The preserved launch example below belongs to the deployment guidance, not to the measured configuration. It explicitly selects method=mtp, proposes two tokens, and limits context to 4096. The benchmark instead passes the separate assistant model without a method key and fixes num_speculative_tokens=4. Treating the example as the benchmark command would change both the proposer selection and the draft length.
vllm serve google/gemma-4-E2B-it \
  --speculative-config '{"method":"mtp","model":"google/gemma-4-E2B-it-assistant","num_speculative_tokens":2}' \
  --dtype bfloat16 --max-model-len 4096
DFlash is outside that comparison. The frozen version notes place its initial support in PR #36847 and v0.20.0, but identify later fixes absent from v0.21.0. These include the FP8 KV-cache fix #42692 and lookahead-slot allocation fix #43733, associated with the v0.22.0 release line. They also list #40391 and #41703 as unresolved on 2026-05-28. Those dated qualifications prevent the batch=1 draft-model result from becoming a compatibility claim for DFlash with an FP8 KV cache.
Before either engine serves requests, pre-downloading both models removes Hugging Face transfer time from subsequent container starts. The weight-warming script below populates gemma-models with the target and assistant. That removes one source of cold-start delay, but it cannot remove every later kernel compilation or graph-capture cost. A warmed weight volume and a warmed speculative execution path are different conditions.
bash deploy/modal/warm_weights.shRequests then reach an OpenAI-compatible interface with either X-API-Key or Authorization: Bearer authentication. The example below shows the message payload and sampling controls. Its max_tokens=256 and temperature=1.0 illustrate API use, not the study's greedy, 128-token workload. In the custom transformers service, response usage includes accepted_tokens, proposed_tokens, and acceptance_rate under speculative_decoding. The native vLLM server exposes acceptance through cumulative metrics instead, a difference that limits prompt-level analysis later.
curl https://<random>.modal.run/v1/chat/completions \
  -H "X-API-Key: ${MODEL_API_KEY}" \
  -H "Content-Type: application/json" \
  -d '{
    "model": "gemma-4-E2B-it",
    "messages": [
      {"role": "system", "content": "You are a helpful assistant."},
      {"role": "user", "content": "Write a short joke about saving RAM."}
    ],
    "max_tokens": 256,
    "temperature": 1.0,
    "top_p": 0.95,
    "top_k": 64
  }'
A service can answer a health check without demonstrating that its draft path is fast or correctly disabled in a baseline. The smoke scripts below deploy each stack, print its HTTPS endpoint, check /healthz, and tear it down. They establish service reachability. The measurement workflow needs additional warmup and zero-proposal checks before an MTP comparison is meaningful.
GPU=h100 bash deploy/modal/smoke_test.sh        # transformers MTP
GPU=h100 bash deploy/modal/vllm_smoke_test.sh   # vLLM stack
Evidence: Which modules serve and measure requests. The launch example that differs from the benchmark. Companion model-serving source. Controls beyond service health.
The comparison holds the draft schedule and workload fixed
The reported runs use batch=1, concurrency=1, 16 requests, max_tokens=128, and temperature=0.0. Each regime rotates eight prompts on Modal. On 2026-06-04, every combination of four GPUs, three regimes, two engines, and two decoding modes was measured in three independent cold runs, n=3. All 144 runs succeeded. The summaries exclude the first timed request, idx=0, because speculative kernel compilation can survive the preliminary warmup. This makes the headline a warm-throughput comparison, not a first-request latency claim.
Throughput and latency answer different questions about those requests. System throughput divides total completion tokens by wall-clock time. TTFT, the time to first token, measures the wait until the first streamed token. TPOT, the time per output token, divides the remaining latency by completion_tokens minus one. TPOT is undefined for a one-token completion. A high token rate therefore does not necessarily mean a short request or a low startup delay. 5
A comparable MTP trial must also hold the draft schedule fixed. The first script below uses the default heuristic schedule and is not the source of the constant-gamma headline. run_const.sh fixes the transformers draft at N=4, matching vLLM's num_speculative_tokens=4. Each A/B workflow deploys MTP, warms and measures it, redeploys the baseline, measures again, and restores MTP. The transformers baseline uses NUM_ASSISTANT_TOKENS=0 even if its assistant remains loaded. The vLLM baseline omits speculative configuration entirely.
# Transformers MTP A/B (default heuristic schedule):
GPU=h100 bash deploy/modal/run_ab.sh

# Transformers MTP, schedule=constant, N=4 (apples-to-apples vLLM parity):
GPU=h100 bash deploy/modal/run_const.sh

# vLLM A/B (num_speculative_tokens=4 vs no-spec-config baseline):
GPU=h100 bash deploy/modal/vllm_run_ab.sh
Each run warms three short requests before timing. Baseline validation separately checks that proposed_tokens stays at zero for three independent requests, rather than trusting a mode label. Within an engine, the reported MTP/baseline ratio is the mean of paired per-run throughput ratios. Across engines, a throughput ratio divides their mean throughputs. These operations are different, so dividing two rounded table means need not reproduce a paired-ratio cell. Mean ± standard deviation describes the three runs, not a confidence interval or a significance test.
The load generator provides a second way to see why settings matter. The preserved command below sends 64 requests at concurrency=4 with a 256-token limit. That is an example invocation, not a reproduction of the reported 16-request, concurrency=1, 128-token experiment. bench/load_runner.py consumes SSE responses and persists JSON plus Prometheus data. Its measurements still depend on the workload supplied to it.
uv run python -m bench.load_runner \
  --base-url https://<endpoint>.modal.run \
  --api-key "${MODEL_API_KEY}" \
  --requests 64 --concurrency 4 --max-tokens 256 \
  --label mtp_on
Prompt selection is the remaining controlled change. PROMPT_SET chooses generic, code, or structured prompts for the same deployment scripts. The example below selects code across all four GPUs and shows separate baseline runs as well as vLLM A/B runs. Mode filters are MODES for transformers and VLLM_MODES for vLLM. Regime labels keep the outputs separate, with the generic suffix omitted for compatibility with existing run names.
# Transformers MTP constant N=4 (PROMPT_SET in {generic,code,structured}):
PROMPT_SET=code bash deploy/modal/run_const.sh H100
PROMPT_SET=code bash deploy/modal/run_const.sh A100-80GB
PROMPT_SET=code bash deploy/modal/run_const.sh A10
PROMPT_SET=code bash deploy/modal/run_const.sh B200

# Transformers baseline (N=0, MTP off):
for GPU in H100 A100-80GB A10 B200; do
  PROMPT_SET=code MODES=baseline bash deploy/modal/run_ab.sh "$GPU"
done

# vLLM A/B (mtp + baseline):
for GPU in H100 A100-80GB A10 B200; do
  PROMPT_SET=code bash deploy/modal/vllm_run_ab.sh "$GPU"
done
The deployment environment adds limits that are not decoding effects. The source records an eight-app web-function cap for a free Modal workspace, so an unrestricted parallel sweep can exhaust deployment slots. The scripts stop deployments they own between cells. The recorded image branches also differ: B200 uses torch==2.9.1+cu128 for sm_100 kernels, while the other GPUs use torch==2.7.0+cu126. Hardware comparisons therefore describe these deployed stacks, not a controlled substitution of the GPU alone.
Evidence: Heuristic and constant-schedule A/B scripts. The differently configured load-runner example. Prompt-regime selection across GPUs. Residual first-request compilation cost.
Only four vLLM combinations stayed above target-only decoding
Google's published results establish why MTP is worth testing, but they do not set a speedup floor for this workload. The table below spans different model sizes and hardware. Google qualifies these numbers as up to, depending on tasks, at batch_size=1 and gamma=4. The 1.5x A100 result concerns the 26B variant, while the larger claims include mobile accelerators and other Gemma variants. None is a matched control for E2B on this four-GPU deployment.
| Variant | Hardware | Published speedup |
|---|---|---|
| Gemma 4 E2B | Samsung S26 mobile GPU | up to 1.8x |
| Gemma 4 E4B | Samsung S26 mobile GPU | up to 2.2x |
| Gemma 4 E2B | Pixel TPU | up to 2.8x |
| Gemma 4 E4B | Pixel TPU | up to 3.1x |
| Gemma 4 31B | Apple M4 | up to 2.5x |
| Gemma 4 26B | NVIDIA A100 | up to 1.5x |
| Gemma 4 31B | NVIDIA A100 | up to 3.0x |
The matched vLLM comparison gives a narrower answer. A10 stays above target-only throughput in all three runs for generic, code, and structured prompts. A100-80GB code does so as well. The other eight GPU-and-regime cells have observed ranges that cross 1.0, even though their means exceed it. The table below summarizes paired per-run ratios. Its emphasis marks an observed three-run range entirely above 1.0, not statistical certainty about future requests.
| GPU | |||
|---|---|---|---|
| A10 | 1.38x ± 0.06 | 2.06x ± 0.41 | 1.79x ± 0.29 |
| A100-80GB | 1.06x ± 0.14 | 1.53x ± 0.25 | 1.07x ± 0.07 |
| B200 | 1.41x ± 0.42 | 1.18x ± 0.29 | 1.22x ± 0.37 |
| H100 | 1.05x ± 0.27 | 1.28x ± 0.43 | 1.37x ± 0.59 |
The plot makes the size of that variation easier to compare across prompt regimes. A10 code has the largest mean ratio, 2.06x ± 0.41, but H100 structured shows why a positive mean is insufficient. Its 1.37x ± 0.59 summarizes runs ranging from 0.72x to 2.14x. Those runs include a slowdown and a speedup. The plot's standard-deviation marks and range-based classification describe different aspects of those three observations.
The same draft length produces different throughput ratios
The chart compares vLLM throughput with MTP against vLLM throughput without MTP. A ratio of 1x is break-even.
The transformers reference path does not reproduce the same pattern of gains. Its summary below includes an A10 generic slowdown and an H100 code slowdown, while structured output produces its clearest gains on A10 and B200. That change across engines matters: the assistant's agreement rate alone cannot explain performance when the runtime changes the cost of obtaining and verifying each draft.
| GPU | |||
|---|---|---|---|
| A10 | 0.78x ± 0.08 | 0.90x ± 0.07 | 1.16x ± 0.11 |
| A100-80GB | 0.93x ± 0.26 | 1.01x ± 0.19 | 0.97x ± 0.12 |
| B200 | 1.24x ± 0.23 | 1.20x ± 0.30 | 1.40x ± 0.26 |
| H100 | 0.85x ± 0.24 | 0.83x ± 0.10 | 1.04x ± 0.01 |
The source overview counts seven positive and two negative cells across both engines, leaving fifteen ranges that cross 1.0. That count includes H100 transformers structured as positive, while the detailed structured discussion calls it breakeven despite retaining 1.04x ± 0.01. This classification conflict remains unresolved. It does not change the four positive vLLM combinations. The regime-by-regime evidence below explains those comparisons without treating the disputed transformers label as settled.
Evidence: Google's task-dependent MTP speedups. The twelve vLLM throughput comparisons. Transformers results and the classification caveat. Why H100 structured remains inconclusive in vLLM.
Generic prompts leave little room for the drafter
The generic regime rotates eight prose prompts. On the transformers path, aggregate acceptance spans 34.6-35.7% across GPUs, so most proposals do not survive verification. The first table pairs that agreement with warm system throughput. A10 falls from 11.67 to 9.14 tokens/s with MTP, giving a paired ratio of 0.78x ± 0.08. Its full run range stays below 1.0. The other three generic transformers ratios cross 1.0, including B200's positive mean.
| GPU | Arch | ||||||
|---|---|---|---|---|---|---|---|
| NVIDIA A10 | Ampere | 8.6 | 600 | 11.67 ± 0.11 | 9.14 ± 0.89 | 0.78x ± 0.08 | 35.7% |
| NVIDIA A100 80GB PCIe | Ampere | 8.0 | 1935 | 9.84 ± 2.53 | 8.46 ± 0.19 | 0.93x ± 0.26 | 35.5% |
| NVIDIA B200 | Blackwell | 10.0 | 7672 | 17.87 ± 4.20 | 21.21 ± 0.98 | 1.24x ± 0.23 | 35.2% |
| NVIDIA H100 80GB HBM3 | Hopper | 9.0 | 3352 | 16.12 ± 2.39 | 13.16 ± 1.51 | 0.85x ± 0.24 | 34.6% |
vLLM changes the absolute token rate much more than enabling MTP changes it within either engine. In the table below, vLLM MTP is 8.9x to 16.9x the transformers MTP mean throughput. Yet its within-engine MTP gain stays above 1.0 in every run only on A10. The two ratio columns answer different questions. With MTP disabled in both engines, the same generic data give a separate engine-throughput ratio of 6.3x to 13.9x. That advantage does not come from accepting draft tokens.
| GPU | ||||||
|---|---|---|---|---|---|---|
| A10 | 9.14 | 100.43 | 72.97 | 1.38x ± 0.06 | 11.0x | 37.3% |
| A100-80GB | 8.46 | 142.73 | 136.76 | 1.06x ± 0.14 | 16.9x | 36.5% |
| B200 | 21.21 | 189.62 | 143.52 | 1.41x ± 0.42 | 8.9x | 37.1% |
| H100 | 13.16 | 166.44 | 164.96 | 1.05x ± 0.27 | 12.6x | 37.2% |
Output length complicates the interpretation of those cross-engine rates. In the generic workload, vLLM emits 2048 completion tokens across 16 requests at the 128-token limit. The source reports shorter transformers output and attributes that difference to an interaction between assisted decoding, rejection sampling, and EOS. Tokens per wall-clock second still describes the work each stack produced. It does not establish equal completion lengths or equivalent output quality, so end-to-end request latency must remain beside throughput.
The first timed request introduces another difference. In the per-prompt comparison below, cold idx=0 is a particular request occurrence, not a reason to discard that prompt's later warm occurrence. H100's cold MTP/baseline ratio is 0.44, compared with 0.98 for the warm occurrence of prompt 0. A10 retains warm ratios above 1.0 across the prompts. The split exposes startup cost without turning the remaining near-breakeven values into dependable gains.
| GPU | |||||||||
|---|---|---|---|---|---|---|---|---|---|
| H100 | 0.44 | 0.98 | 1.04 | 1.03 | 1.06 | 1.03 | 0.90 | 1.05 | 0.99 |
| A100-80GB | 0.71 | 1.06 | 1.06 | 1.04 | 1.08 | 1.04 | 0.92 | 1.15 | 1.04 |
| A10 | 0.90 | 1.39 | 1.49 | 1.35 | 1.42 | 1.32 | 1.26 | 1.48 | 1.35 |
| B200 | 1.17 | 1.29 | 1.38 | 1.35 | 1.35 | 1.26 | 1.28 | 1.37 | 1.29 |
Averaging those prompt-level ratios shows how one cold occurrence can change a descriptive result. H100 moves from 0.95 when cold idx=0 is included to 1.01 when it is dropped. A10 remains above 1.0 either way. These are means of prompt ratios, not replacements for the run-level aggregate throughput comparison. Their different aggregation explains why the warm figures below need not equal the headline ratios.
| GPU | |||
|---|---|---|---|
| H100 | 0.95 | 1.01 | 0.90 to 1.06 |
| A100-80GB | 1.01 | 1.05 | 0.92 to 1.15 |
| A10 | 1.33 | 1.38 | 1.26 to 1.49 |
| B200 | 1.30 | 1.32 | 1.26 to 1.38 |
The engine advantage persists when the same generic prompts are compared individually. The table below holds speculative draft length at four in both implementations and divides vLLM throughput by transformers throughput. The cold occurrence produces a smaller ratio on every GPU than the listed warm occurrences. Warm ratios span 8.1x to 21.7x across the grid. That pattern supports an engine-level difference without identifying which attention kernel or scheduler feature causes it.
| GPU | ||||||||
|---|---|---|---|---|---|---|---|---|
| H100 | 6.6 | 13.5 | 11.7 | 14.3 | 13.4 | 10.9 | 15.8 | 10.6 |
| A100-80GB | 8.1 | 18.0 | 15.4 | 19.4 | 16.4 | 14.8 | 21.7 | 15.2 |
| A10 | 8.0 | 12.3 | 10.1 | 12.3 | 10.1 | 9.9 | 13.4 | 10.1 |
| B200 | 7.1 | 9.6 | 8.6 | 10.1 | 8.4 | 8.1 | 11.1 | 8.1 |
Agreement varies more by prompt than by the GPU running it. In the transformers prompt grid below, mean acceptance across the eight prompts spans 35.1-36.1% by GPU, while the within-GPU prompt spread spans 16.7-27.3 percentage points. These prompt means differ from the aggregate acceptance statistic above. Binary search at idx=1 is more predictable for the drafter than the PagedAttention-versus-FlashAttention explanation at idx=5. The prompt's content changes the opportunity for speculation before hardware determines its cost.
| GPU | ||||||||||
|---|---|---|---|---|---|---|---|---|---|---|
| A10 | 33.0% | 44.6% | 33.2% | 38.9% | 34.7% | 27.9% | 40.4% | 36.4% | 36.1% | 16.7 |
| A100-80GB | 32.0% | 47.4% | 33.3% | 36.2% | 37.6% | 28.8% | 39.5% | 32.6% | 35.9% | 18.6 |
| B200 | 33.0% | 50.9% | 34.4% | 40.4% | 32.4% | 23.6% | 39.5% | 34.3% | 36.1% | 27.3 |
| H100 | 33.0% | 43.2% | 26.3% | 41.6% | 32.9% | 29.7% | 39.5% | 34.9% | 35.1% | 16.9 |
There is no matching vLLM per-prompt acceptance grid. Its native server exposes spec_decode_num_accepted_tokens_total and spec_decode_num_draft_tokens_total through process-cumulative /metrics, not per-response usage.speculative_decoding. The study obtains vLLM acceptance from counter deltas over the benchmark wall interval. Those aggregates cannot establish which individual prompt accepted which proposals. Code prompts test the next question at the regime level: whether more predictable token sequences create a larger useful draft.
Evidence: Generic transformers throughput and acceptance. Within-engine and cross-engine generic ratios. Effect of excluding the cold occurrence. Prompt-level agreement differences.
Code raises acceptance, but only some GPUs turn it into speed
The code regime rotates two_sum, merge_sort, is_balanced, LRUCache, quicksort, Dijkstra, flatten, and binary_tree. Familiar syntax gives the drafter more repeated structure to predict. In the comparison below, transformers acceptance rises to 50.0-51.0%, but its throughput barely improves or falls relative to generic prompts. vLLM MTP gains more throughput on A10 and A100-80GB. The same shift in agreement therefore has different consequences in the two engines.
| GPU | ||||||||
|---|---|---|---|---|---|---|---|---|
| A10 | 9.14 | 9.73 | 1.06x | 100.43 | 136.04 | 1.35x | 35.7% | 50.5% |
| A100-80GB | 8.46 | 8.38 | 0.99x | 142.73 | 203.26 | 1.42x | 35.5% | 51.0% |
| B200 | 21.21 | 19.37 | 0.91x | 189.62 | 190.83 | 1.01x | 35.2% | 50.7% |
| H100 | 13.16 | 13.46 | 1.02x | 166.44 | 189.64 | 1.14x | 34.6% | 50.0% |
vLLM's aggregate code acceptance is 52.5% on A10, 52.6% on A100-80GB, 52.3% on B200, and 52.4% on H100. Combining those values with the displayed transformers means gives a per-GPU code acceptance range of 50.0-52.6%. The frozen executive summary instead reports 49.8-52.6%. That discrepancy is unresolved. The available means support higher agreement on code than on generic prompts, not a silently corrected lower endpoint.
Code can change target-only throughput as well, so comparing code MTP with generic MTP does not isolate speculation. The baseline table below removes the drafter's proposals from both engines. Its code-versus-generic changes are not uniform across GPUs. vLLM's baseline engine advantage on code spans 6.1x to 15.7x over transformers, independent of MTP. That is a separate measured range from the 8.9x to 26.8x cross-engine MTP range across all regimes.
| GPU | ||||||
|---|---|---|---|---|---|---|
| A10 | 11.67 | 10.85 | 0.93x | 72.97 | 66.62 | 0.91x |
| A100-80GB | 9.84 | 8.55 | 0.87x | 136.76 | 133.88 | 0.98x |
| B200 | 17.87 | 16.57 | 0.93x | 143.52 | 167.52 | 1.17x |
| H100 | 16.12 | 16.02 | 0.99x | 164.96 | 157.22 | 0.95x |
Dividing MTP by its own baseline gives the relevant code speedup comparison. A10 vLLM code reaches 2.06x ± 0.41 with an observed range of 1.54x to 2.52x. A100-80GB reaches 1.53x ± 0.25, ranging from 1.25x to 1.86x. Both ranges stay above 1.0. B200's 0.91x to 1.59x and H100's 0.96x to 1.90x cross 1.0. On transformers, no code cell is a consistent gain across the runs, and H100's 0.83x ± 0.10 is a consistent slowdown in this sample.
| GPU | ||||
|---|---|---|---|---|
| A10 | 0.78x ± 0.08 | 0.90x ± 0.07 | 1.38x ± 0.06 | 2.06x ± 0.41 |
| A100-80GB | 0.93x ± 0.26 | 1.01x ± 0.19 | 1.06x ± 0.14 | 1.53x ± 0.25 |
| B200 | 1.24x ± 0.23 | 1.20x ± 0.30 | 1.41x ± 0.42 | 1.18x ± 0.29 |
| H100 | 0.85x ± 0.24 | 0.83x ± 0.10 | 1.05x ± 0.27 | 1.28x ± 0.43 |
The acceptance grid helps distinguish a repeatable prompt property from a repeatable timing gain. Code prompt means remain near 50% across the four transformers deployments. Their within-GPU spreads are smaller than the generic spreads, although H100 reaches 12.1 percentage points, above the 6.7-9.5 range stated in the original prose. The grid retains that H100 value. More uniform agreement is a plausible reason code helps the drafter, but the timing comparison still has to cover drafting and verification costs.
| GPU | ||||||||||
|---|---|---|---|---|---|---|---|---|---|---|
| A10 | 56.3% | 54.4% | 48.9% | 48.8% | 48.7% | 48.0% | 50.6% | 48.3% | 50.5% | 8.3 |
| A100-80GB | 57.2% | 54.4% | 49.4% | 47.7% | 49.1% | 51.5% | 50.6% | 48.3% | 51.0% | 9.5 |
| B200 | 53.1% | 54.4% | 47.7% | 48.8% | 49.1% | 51.5% | 52.4% | 48.3% | 50.7% | 6.7 |
| H100 | 55.1% | 54.4% | 47.7% | 43.0% | 49.1% | 49.7% | 50.6% | 50.0% | 50.0% | 12.1 |
The per-prompt engine comparison below shows that vLLM's advantage is not confined to one code task. On A100-80GB, the listed warm ratios range from 22.2x to 26.9x. B200 has a smaller gap, including a 9.0x warm ratio for one prompt. These prompt-level values should not be replaced by a claim that every warm code prompt exceeds 10x. They also remain engine comparisons, not the within-vLLM benefit of enabling MTP.
| GPU | ||||||||
|---|---|---|---|---|---|---|---|---|
| H100 | 11.7 | 16.1 | 15.6 | 14.2 | 13.8 | 12.7 | 13.4 | 13.3 |
| A100-80GB | 7.7 | 25.5 | 26.9 | 23.0 | 24.3 | 23.9 | 22.2 | 22.6 |
| A10 | 9.8 | 16.0 | 15.6 | 13.9 | 13.8 | 12.3 | 13.2 | 13.3 |
| B200 | 6.6 | 11.0 | 10.5 | 9.7 | 10.3 | 9.0 | 9.6 | 9.5 |
End-to-end latency gives the corresponding request-level view. The table below includes the first cold request instead of hiding it inside a throughput average. On A100-80GB, vLLM's warm mean is 644 ms, compared with 2267 ms for its cold request and 4729 ms for the transformers warm mean. That distinction matters for an interactive caller who waits for a response. It still does not remove the need to examine completion lengths when comparing engines.
| GPU | ||||
|---|---|---|---|---|
| A10 | 4079 | 1619 | 4089 | 964 |
| A100-80GB | 4561 | 2267 | 4729 | 644 |
| B200 | 2283 | 1830 | 2121 | 689 |
| H100 | 3105 | 1029 | 3204 | 714 |
Code establishes that higher agreement can coincide with a useful MTP gain, especially in the measured A10 and A100-80GB vLLM stacks. It does not establish a threshold acceptance rate that guarantees a gain on every GPU. Structured prompts raise agreement further and make that limitation more visible.
Evidence: Code baseline engine comparison with MTP disabled. Code MTP gains and three-run uncertainty. Code acceptance by prompt. Cold and warm code request latency.
Structured output makes agreement easier, not speed certain
The structured regime uses eight JSON, YAML, TOML, OpenAPI, and GeoJSON skeleton prompts. The hypothesis is that constrained syntax makes the target's next token easier for the assistant to predict. Aggregate acceptance rises to 52.5-58.0% across engines and GPUs. In vLLM it reaches 57.0-58.0%, yet only A10 keeps its MTP/baseline ratio above 1.0 in every run. The table below puts the agreement and timing measures together so that neither substitutes for the other.
| GPU | ||||||||
|---|---|---|---|---|---|---|---|---|
| A10 | 7.22 | 6.28 | 1.16x ± 0.11 | 111.55 | 64.15 | 1.79x ± 0.29 | 55.3% | 57.1% |
| A100-80GB | 5.83 | 6.11 | 0.97x ± 0.12 | 156.37 | 147.27 | 1.07x ± 0.07 | 54.7% | 58.0% |
| B200 | 11.65 | 8.32 | 1.40x ± 0.26 | 182.74 | 157.66 | 1.22x ± 0.37 | 52.5% | 57.0% |
| H100 | 9.32 | 8.98 | 1.04x ± 0.01 | 211.05 | 156.56 | 1.37x ± 0.59 | 52.8% | 57.2% |
A10's structured vLLM ratio is 1.79x ± 0.29, with a range of 1.42x to 2.13x. A100-80GB's 1.07x ± 0.07 includes a run at 0.97x. H100 is more variable: its runs are 2.14x, 1.25x, and 0.72x, summarized as 1.37x ± 0.59 in the source. The observed 0.72x to 2.14x range supports neither a dependable gain nor a claim of established breakeven. Higher aggregate agreement has not removed timing uncertainty.
The engine comparison remains much larger than most within-engine changes. For structured prompts, the ratios of mean MTP throughputs are 15.5x on A10, 26.8x on A100-80GB, 15.7x on B200, and 22.6x on H100. With MTP off, the corresponding baseline engine ratios are 10.2x, 24.1x, 18.9x, and 17.4x. These are distinct comparisons. The overall MTP engine range of 8.9x to 26.8x must not be described as a universal range for both decoding modes.
Individual structured tasks are less uniform than their regime label suggests. The fully specified JSON object at idx=0 accepts 94.2% of proposals on every transformers deployment, while GeoJSON coordinates at idx=5 fall as low as 37.8%. The grid below has a within-GPU spread of 52.5-56.4 percentage points, the widest of the three regimes. Its mean column averages prompt percentages, which is different from dividing all accepted tokens by all proposed tokens in a run.
| GPU | ||||||||||
|---|---|---|---|---|---|---|---|---|---|---|
| A10 | 94.2% | 44.0% | 62.8% | 57.1% | 74.2% | 41.7% | 48.5% | 56.4% | 59.9% | 52.5 |
| A100-80GB | 94.2% | 44.0% | 62.8% | 54.6% | 74.2% | 37.8% | 52.1% | 56.4% | 59.5% | 56.4 |
| B200 | 94.2% | 44.0% | 62.8% | 54.6% | 56.4% | 37.8% | 48.5% | 58.6% | 57.1% | 56.4 |
| H100 | 94.2% | 44.0% | 62.8% | 54.6% | 56.4% | 37.8% | 52.1% | 56.4% | 57.3% | 56.4 |
High acceptance does not even rank these prompts by throughput. In the per-prompt transformers results below, the almost fully accepted JSON object is not the fastest task on any GPU. On B200 it reaches 12.8 tokens/s, while the OpenAPI path at idx=7 reaches 16.6 tokens/s with much lower acceptance. Request length, prefill, drafting, and verification can all affect system tokens/s. The table shows why an agreement percentage cannot replace a direct time measurement.
| GPU | ||||||||
|---|---|---|---|---|---|---|---|---|
| A10 | 8.2 | 6.0 | 8.6 | 6.0 | 5.7 | 5.9 | 8.5 | 9.8 |
| A100-80GB | 7.8 | 4.8 | 7.4 | 4.9 | 4.8 | 4.6 | 6.3 | 8.1 |
| B200 | 12.8 | 9.8 | 14.2 | 9.7 | 8.1 | 9.5 | 14.1 | 16.6 |
| H100 | 11.0 | 8.1 | 11.8 | 7.9 | 6.6 | 7.6 | 10.4 | 13.0 |
The tradeoff can now be stated without assuming that more accepted tokens always mean faster generation. Every speculative round pays for the assistant and target verification. Accepted proposals can avoid later target passes, but only the balance of those costs determines elapsed time. The illustration below summarizes that causal account. It is qualitative, not a fit to these measurements or an acceptance threshold inferred from them.
Accepted proposals must save more time than drafting and verification add
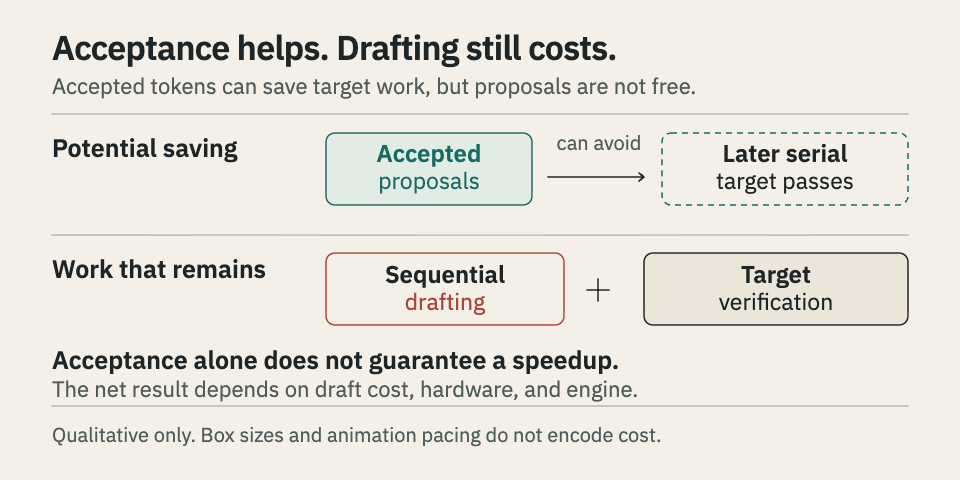
The available evidence stops short of a complete cost breakdown. vLLM per-prompt acceptance is unavailable in every regime because only process-cumulative counters were collected. Per-prompt MFU, MBU, and TPOT detail is not tabulated either. The structured results support a relation between prompt predictability and agreement. They do not attribute each prompt's measured runtime to a specific GPU operation.
Evidence: Structured aggregate throughput and agreement. The wide acceptance spread between structured tasks. Throughput does not follow acceptance alone. Startup and utilization limits on interpretation.
Cold requests and utilization estimates set the limits
The headline excludes cold idx=0 because a short warmup does not necessarily compile the speculative kernels used by the measured request. Container initialization is outside the benchmark wall clock, but the first timed request can still pay for drafter initialization and kernel JIT. The cold-versus-warm table below measures that residual cost on a system-throughput basis. In the generic vLLM MTP cells, cold throughput is 0.35-0.74 of warm throughput, compared with the source's 0.82-0.98 baseline range. The penalty is asymmetric.
| vllm_mtp cell | |||
|---|---|---|---|
| A10 generic | 63.9 ± 14.2 | 100.4 ± 3.4 | 0.64x |
| A100-80GB generic | 50.1 ± 20.6 | 142.7 ± 7.0 | 0.35x |
| B200 generic | 140.1 ± 38.4 | 189.6 ± 22.0 | 0.74x |
| H100 generic | 68.6 ± 12.3 | 166.4 ± 22.7 | 0.41x |
| A100-80GB structured | 64.1 ± 36.2 | 156.4 ± 5.5 | 0.41x |
For this comparison, cold tokens/s is idx=0 completion_tokens divided by its end-to-end seconds. Warm tokens/s divides total completion tokens by total end-to-end seconds over idx=1 through idx=15. That is not the mean of per-request decode_tokens_per_sec, which excludes TTFT and changes the weighting. Removing one cold occurrence also does not remove the remaining variability. The source describes warm-throughput spread commonly at 10-40% of the mean. Three runs cannot establish a confidence interval for a production workload.
Utilization estimates require more assumptions than measured throughput. MFU compares modeled computation with peak compute rate. MBU compares modeled memory traffic with peak memory bandwidth. Repeated weight reads at batch=1 make bandwidth a plausible constraint, so MBU can be more informative than a low MFU alone. The study models these quantities from output measurements and hardware denominators. They are not direct observations of inference-server utilization, because the separate benchmark GPU probes its own board. 6
The MFU formula below uses the dense forward-pass estimate of two operations per active parameter per token. The study substitutes N_active=1.91 billion, excluding PLE lookup storage from the matrix-multiplication count. Its model card's 2.3 billion effective count is not reconciled with that choice. At fixed throughput and peak, the displayed equation makes MFU proportional to N_active. The frozen source's reciprocal rescaling note conflicts with that equation, so it is not a reliable correction to the reported estimates.
FLOPs/token = 2 * N_active                    (Kaplan 2020)
achieved_TFLOPS = FLOPs/token * tokens/sec / 1e12
MFU = achieved_TFLOPS / peak_TFLOPS
The bandwidth estimate below similarly depends on modeled bytes per output token. The study sets param_bytes=10,246,621,918 and kv_cache_bytes=0, explicitly a lower bound that omits KV-cache traffic. TPOT must be expressed in seconds for the displayed conversion to GB/s. B200 adds another qualification to utilization interpretation: its compute peak uses a provisional 8192 FP16 operations per cycle per SM, yielding the table's 2382.40 TFLOPS. That compute constant affects MFU's denominator, not the measured throughput, TPOT, latency, or acceptance. The MBU equation has separate byte and peak-bandwidth assumptions.
bytes/token = param_bytes + kv_cache_bytes
achieved_GBps = bytes/token / TPOT / 1e9
MBU = achieved_GBps / peak_HBM_GBps
The proposed explanation for A10's gains is that a slower target decode leaves more time for accepted proposals to repay drafting overhead. The measurements are consistent with that explanation, but they do not isolate its cause. Different engine implementations, GPU-specific images, output lengths, and residual startup behavior remain part of the comparison. No experiment here establishes the same result at higher concurrency, another context length, a different gamma, or a different prompt distribution.
Evidence: Measured residual cold-request cost. MFU formula and active-parameter assumption. MBU formula and byte-count lower bound. Study source, model cards, and technical references.
The useful decision is whether the target work saved by accepted drafts exceeds the cost of producing and checking them in the intended service. This study makes that comparison for one small, greedy, single-request workload. A broader deployment claim would need matched output-length checks, a warmup that covers the measured speculative path, and repeated measurements under the service's actual traffic. Acceptance helps explain where to look. Elapsed time determines whether MTP helped.